Data Visualisation and information design
Miscellaneous Data Visualisation and Information Design
NSW Department of Education 2019 - ongoing
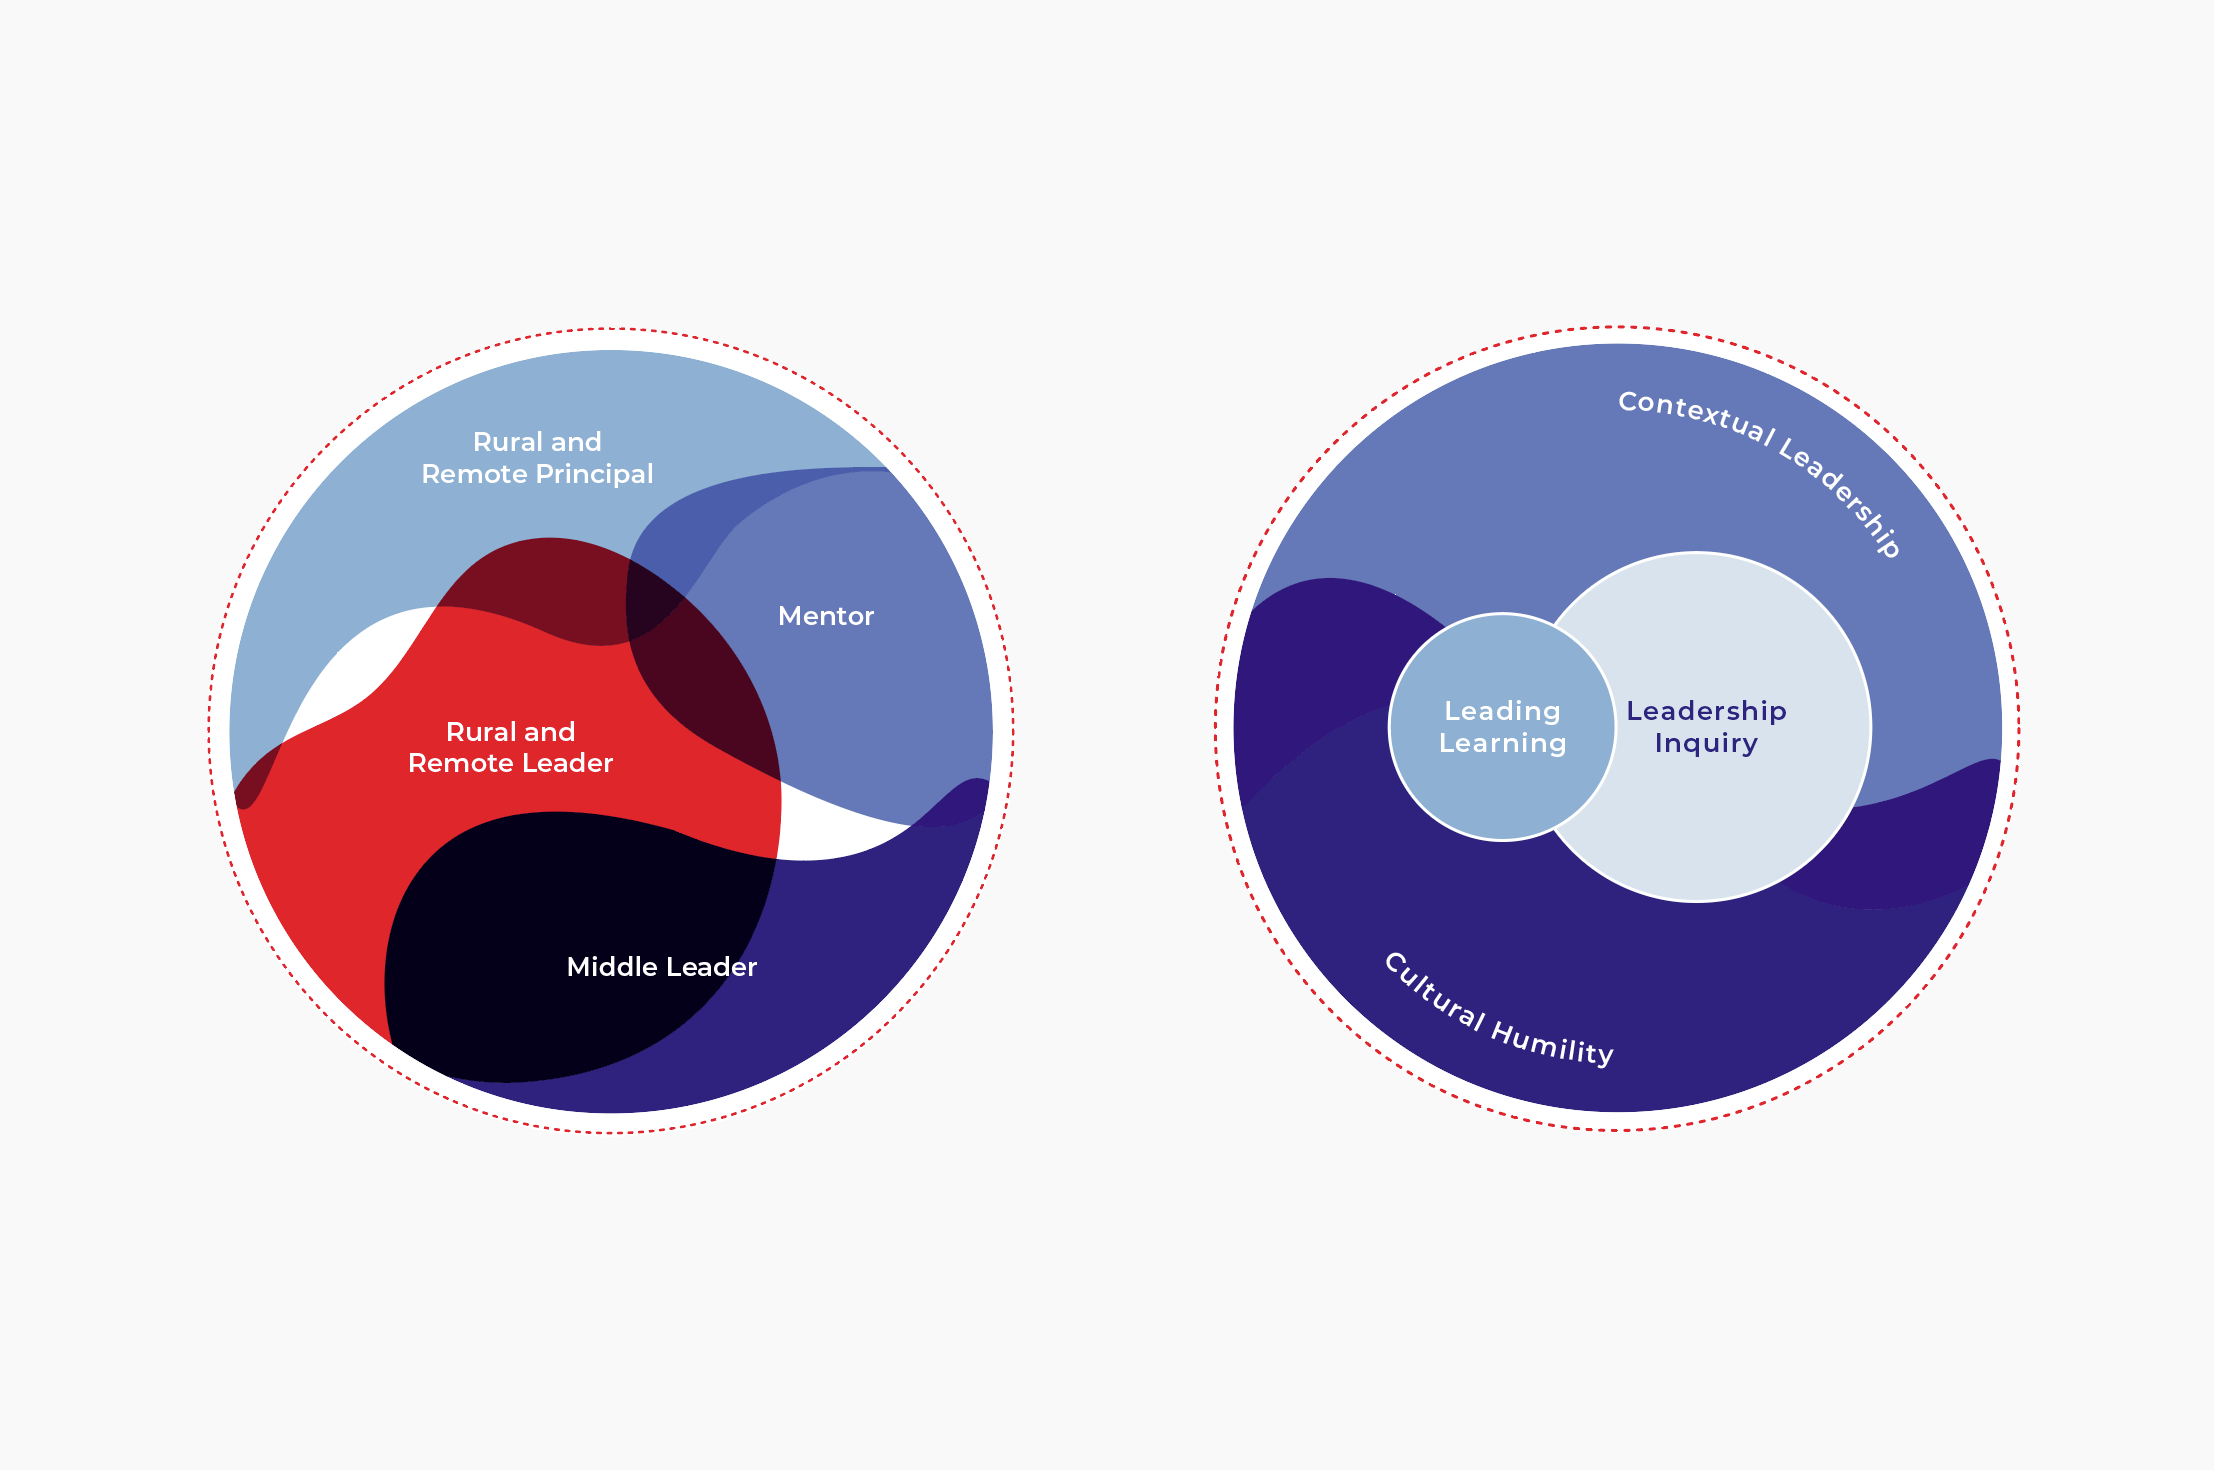
Much of my work as a designer involves visualising processes, systems and frameworks for companies and institutions. An example of this type of work can be seen in this ongoing project for the NSW Department of Education. Here, I have designed a suite of graphics which visualise aspects of the Department’s work and initiatives in a coherent and cohesive manner. The graphics presented here help the department define processes, systems and frameworks which are complex, interconnected and difficult to articulate verbally. Through visualisation, these concepts are elucidated are communicated in a compelling manner.
These graphics were developed in close collaboration with the department.
EdScreening 2020 - ongoing
I have worked as a consultant design strategist for EdScreening — an evidence-based comprehensive online educational screening program — since 2020. As part of this project graphics were developed to visualise the screening process. Like the graphics produced for the NSW Department of Education above, this work aimed to visualise the complex and interconnected processes and systems underpinning the EdScreening program in simply and effectively.
Graphs, charts and diagrams
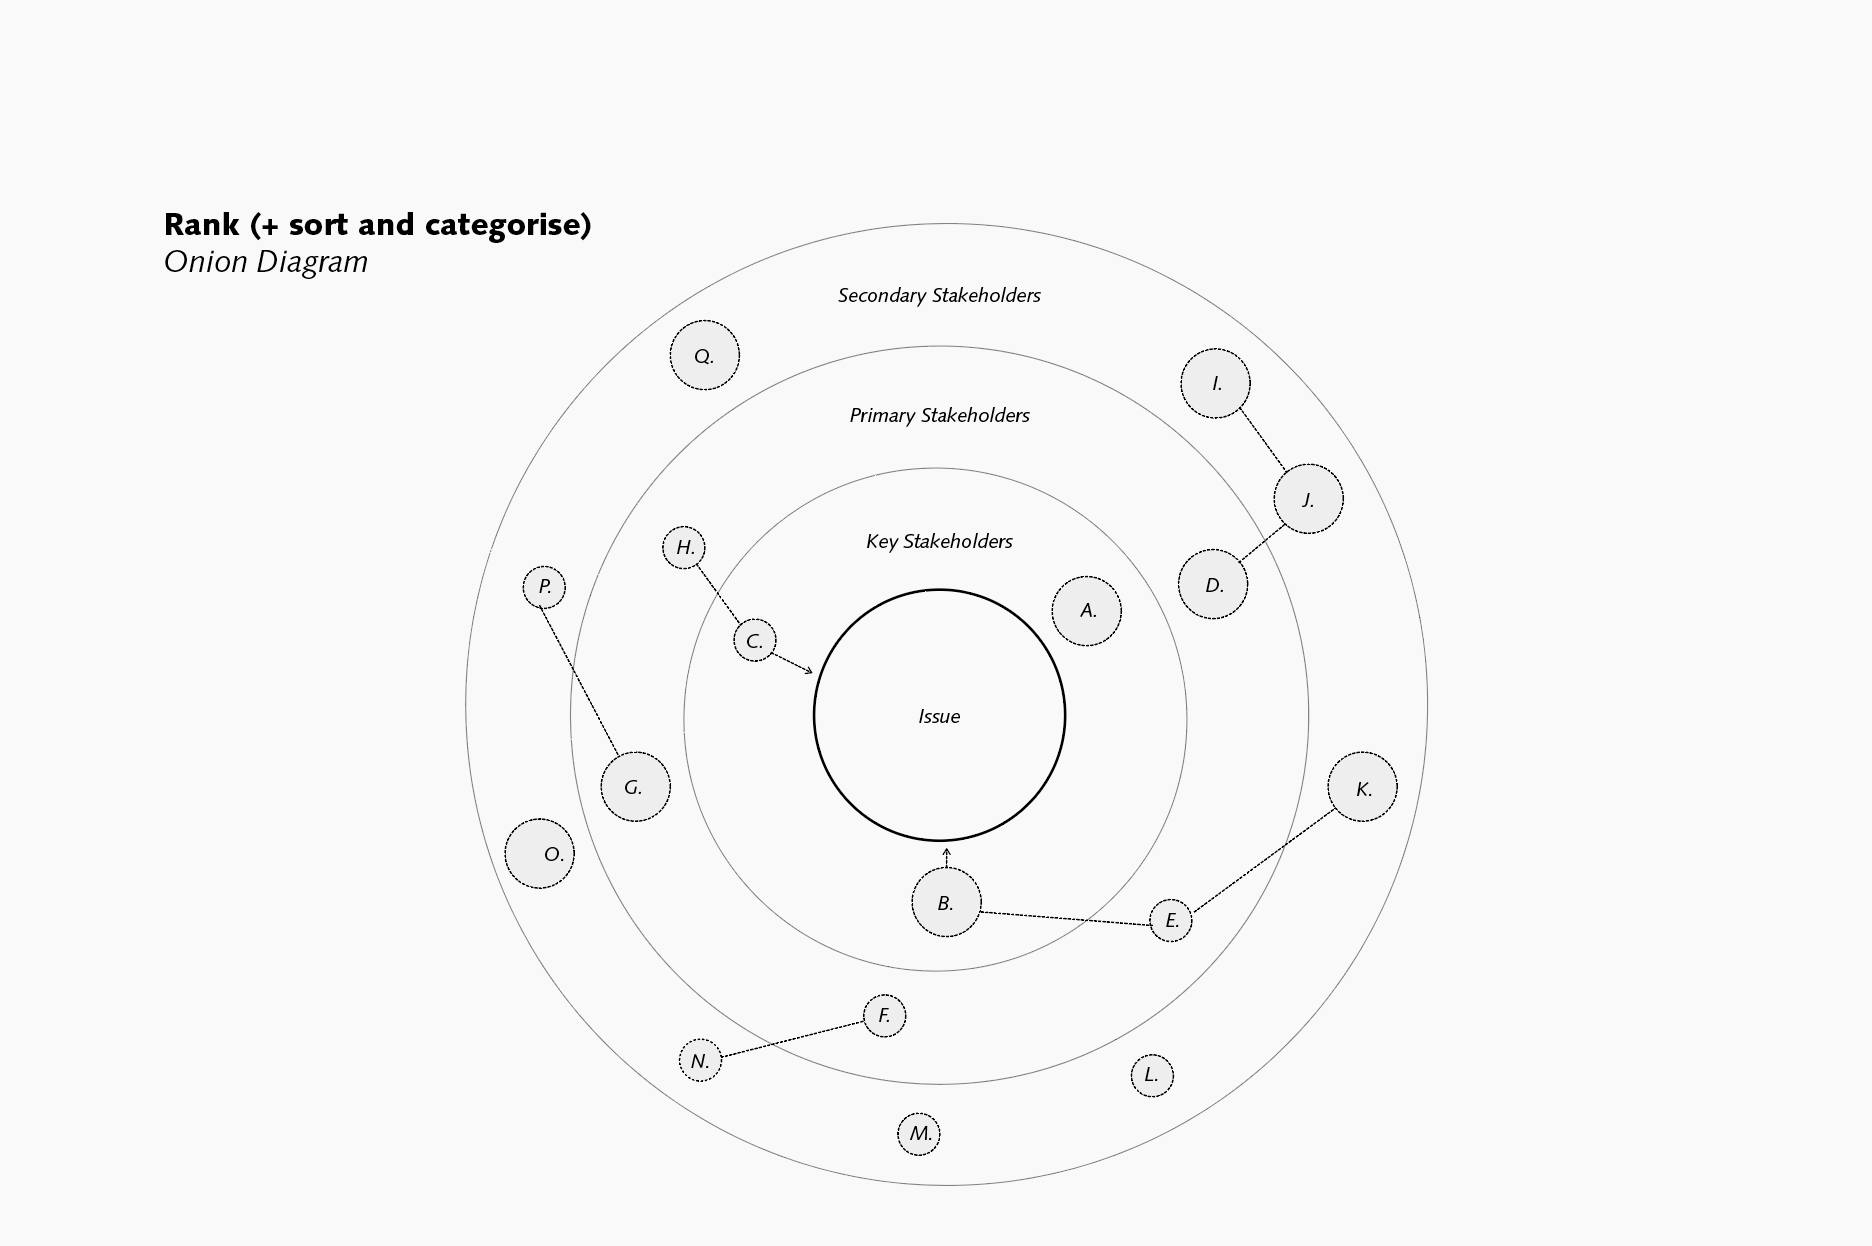
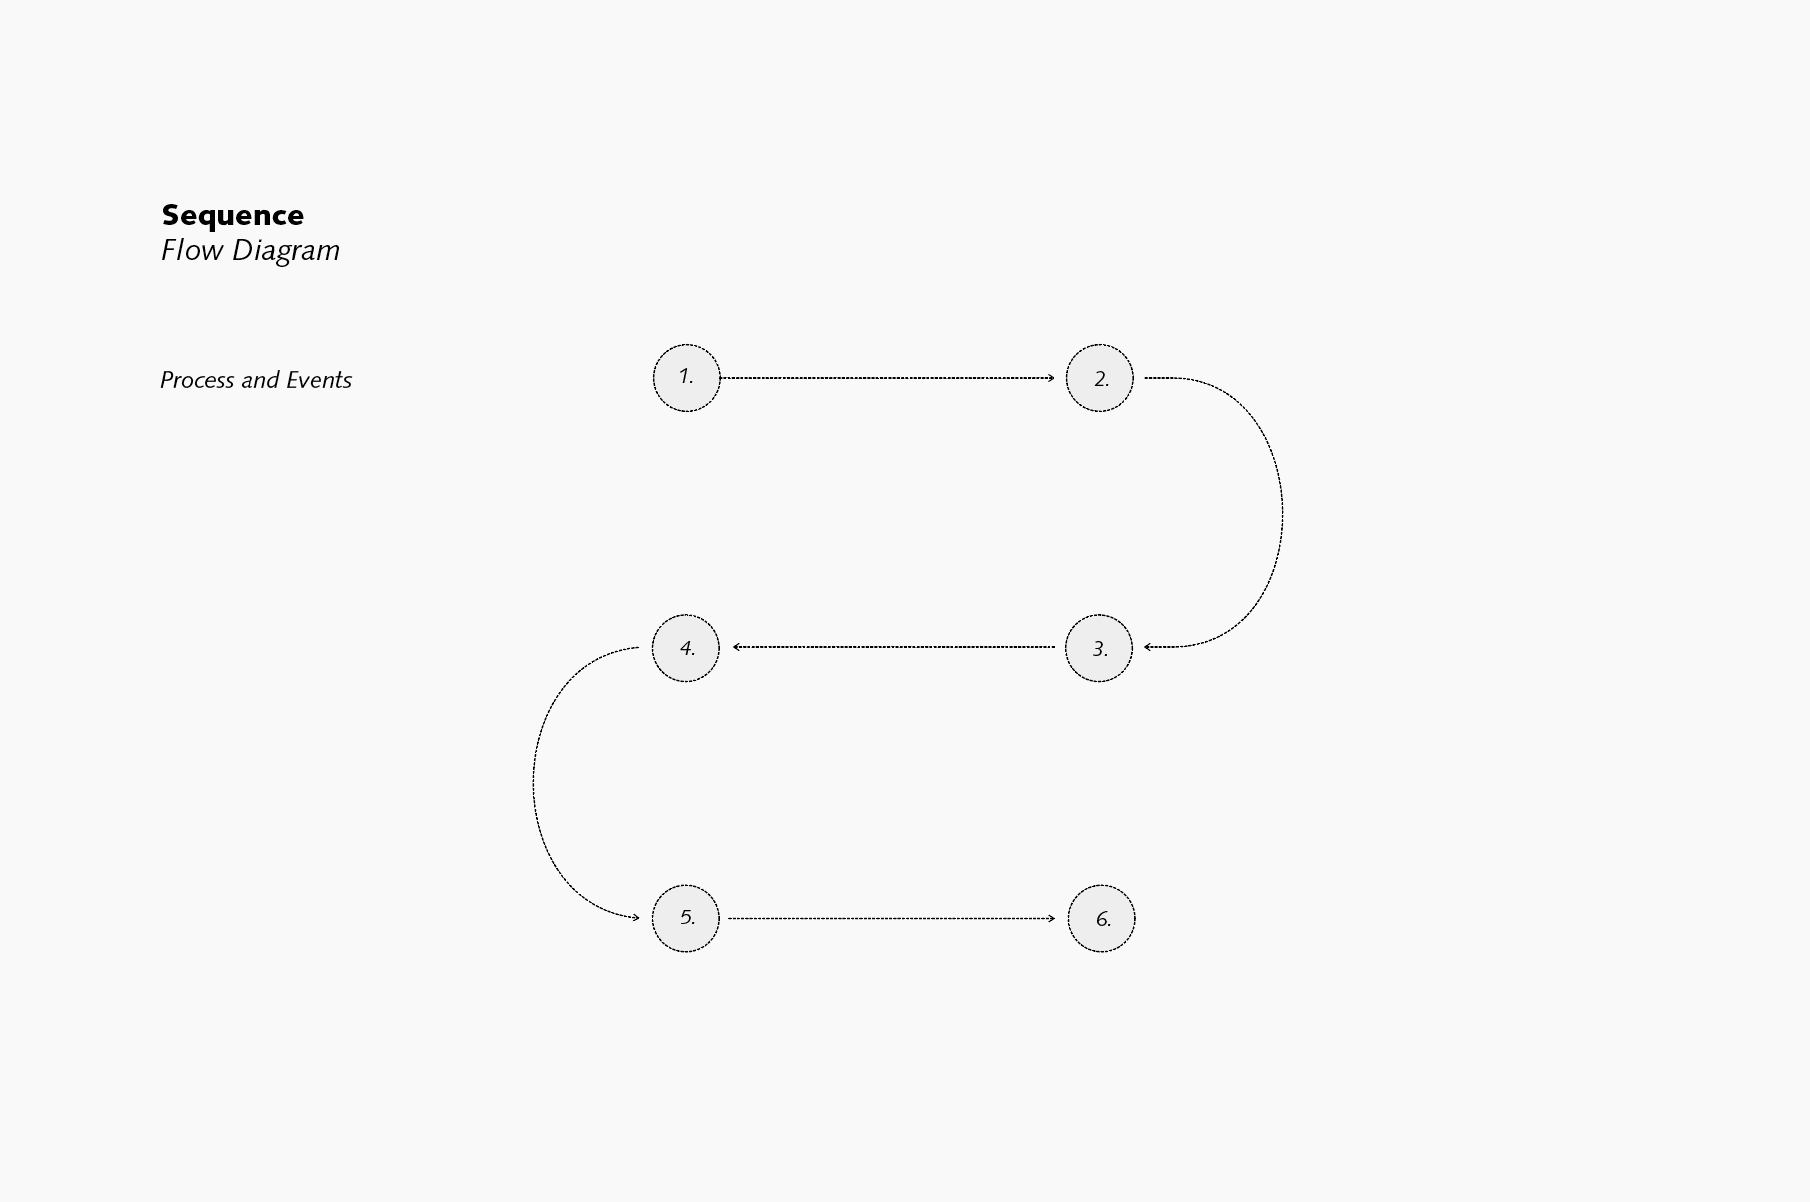
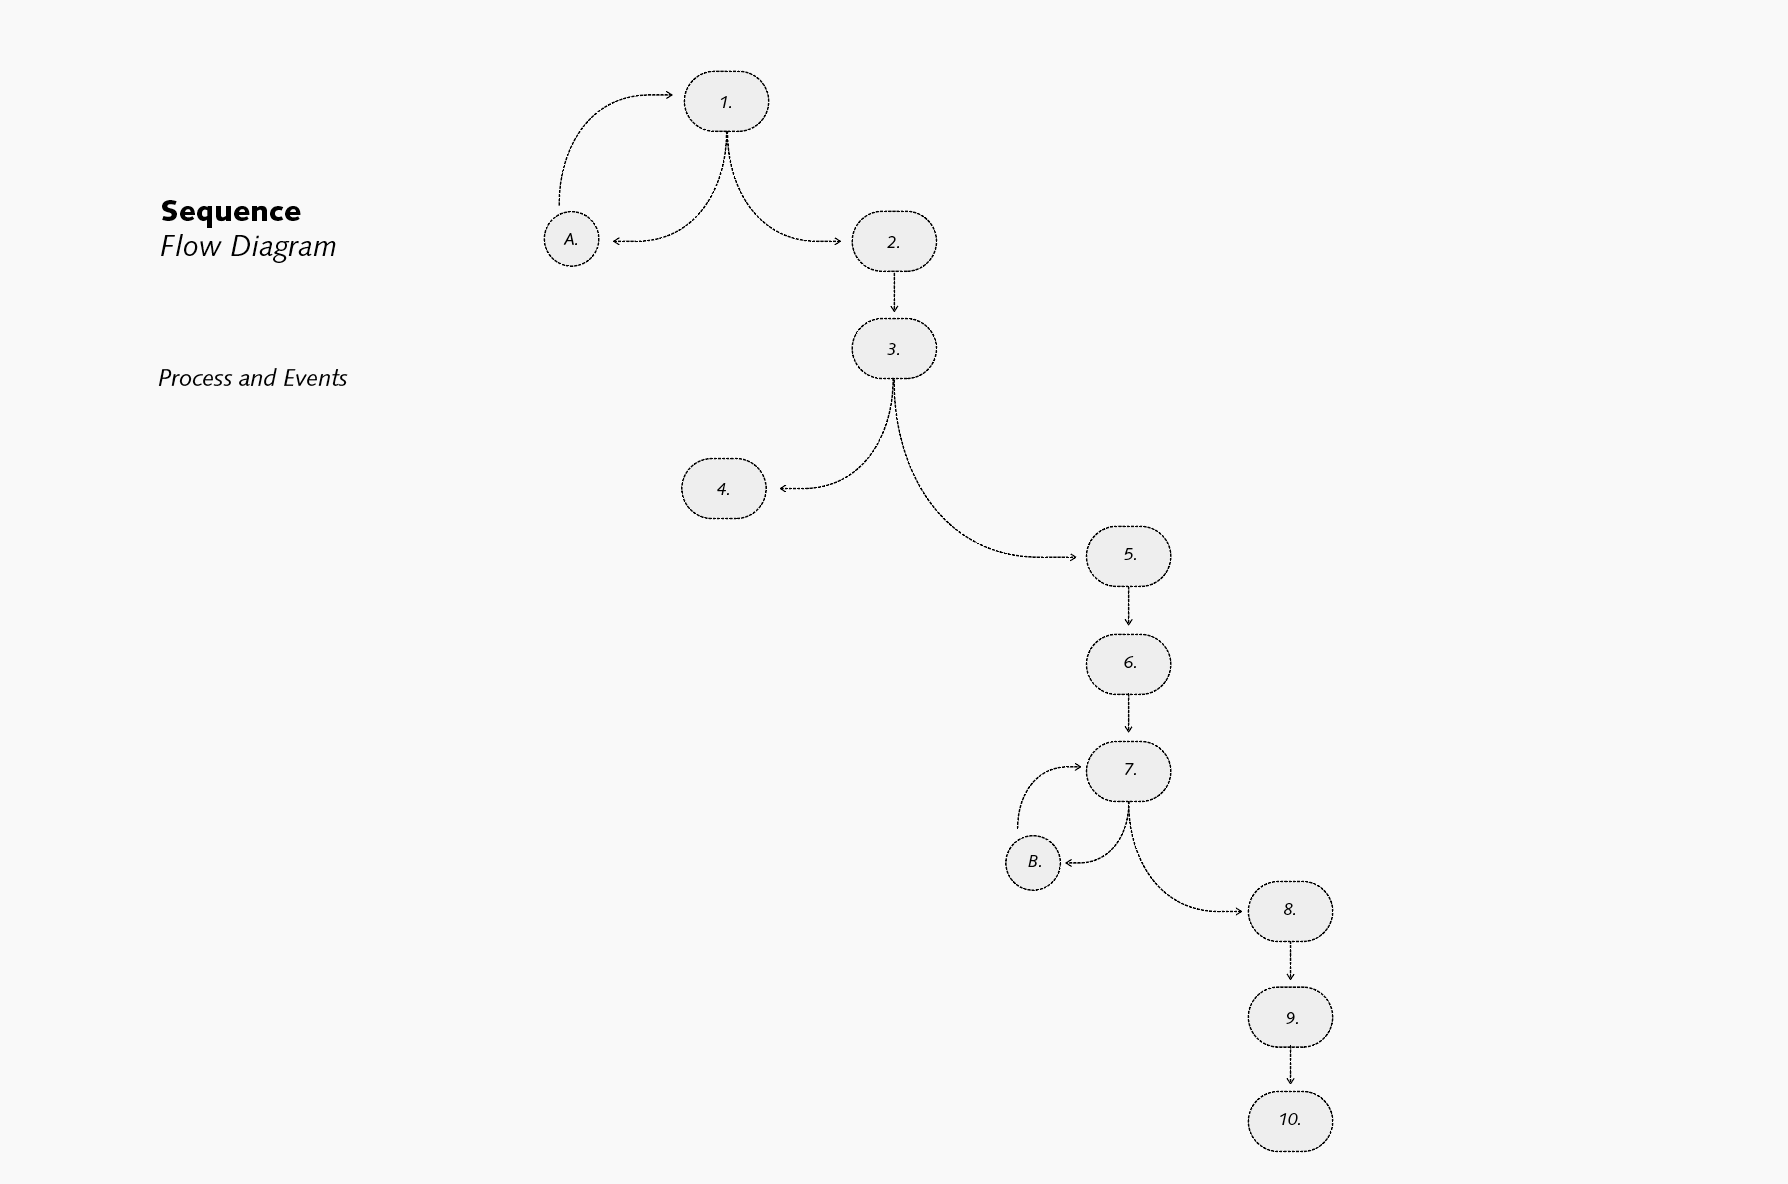
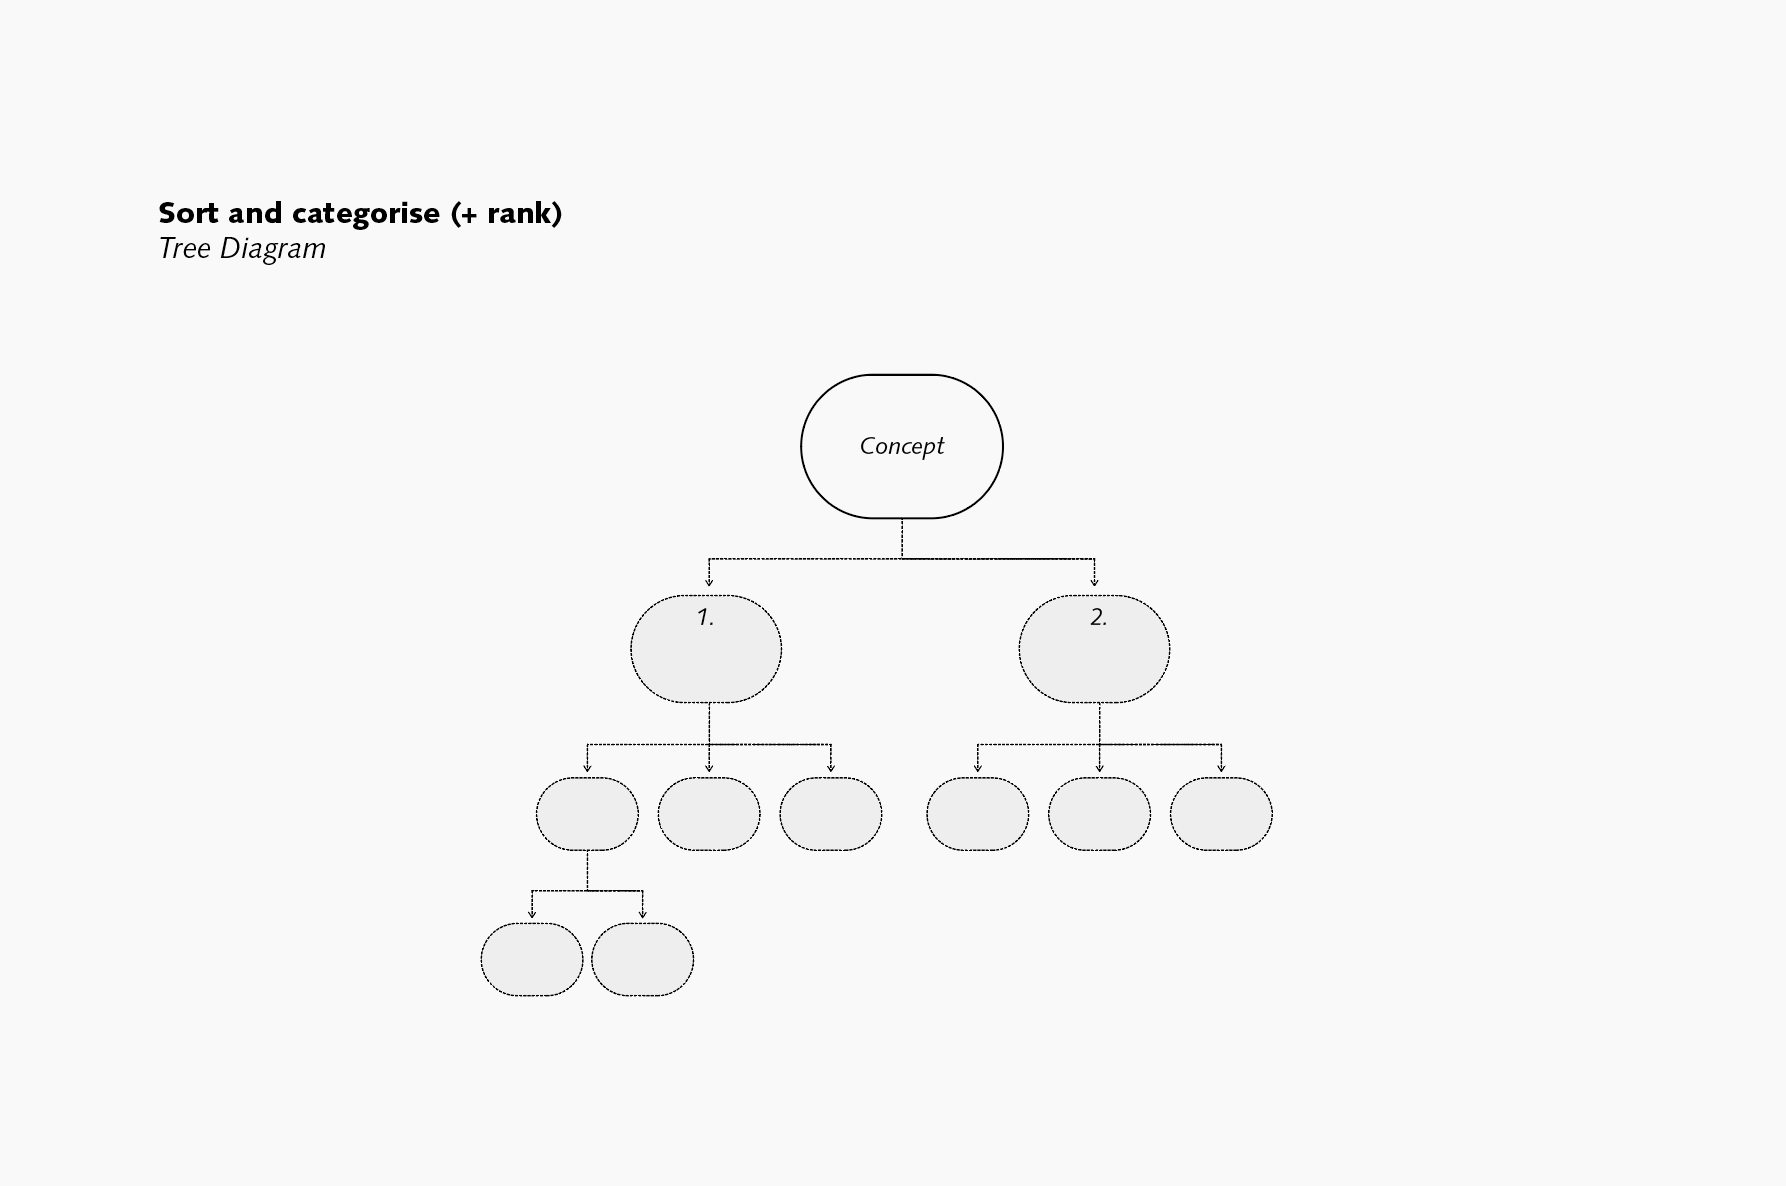
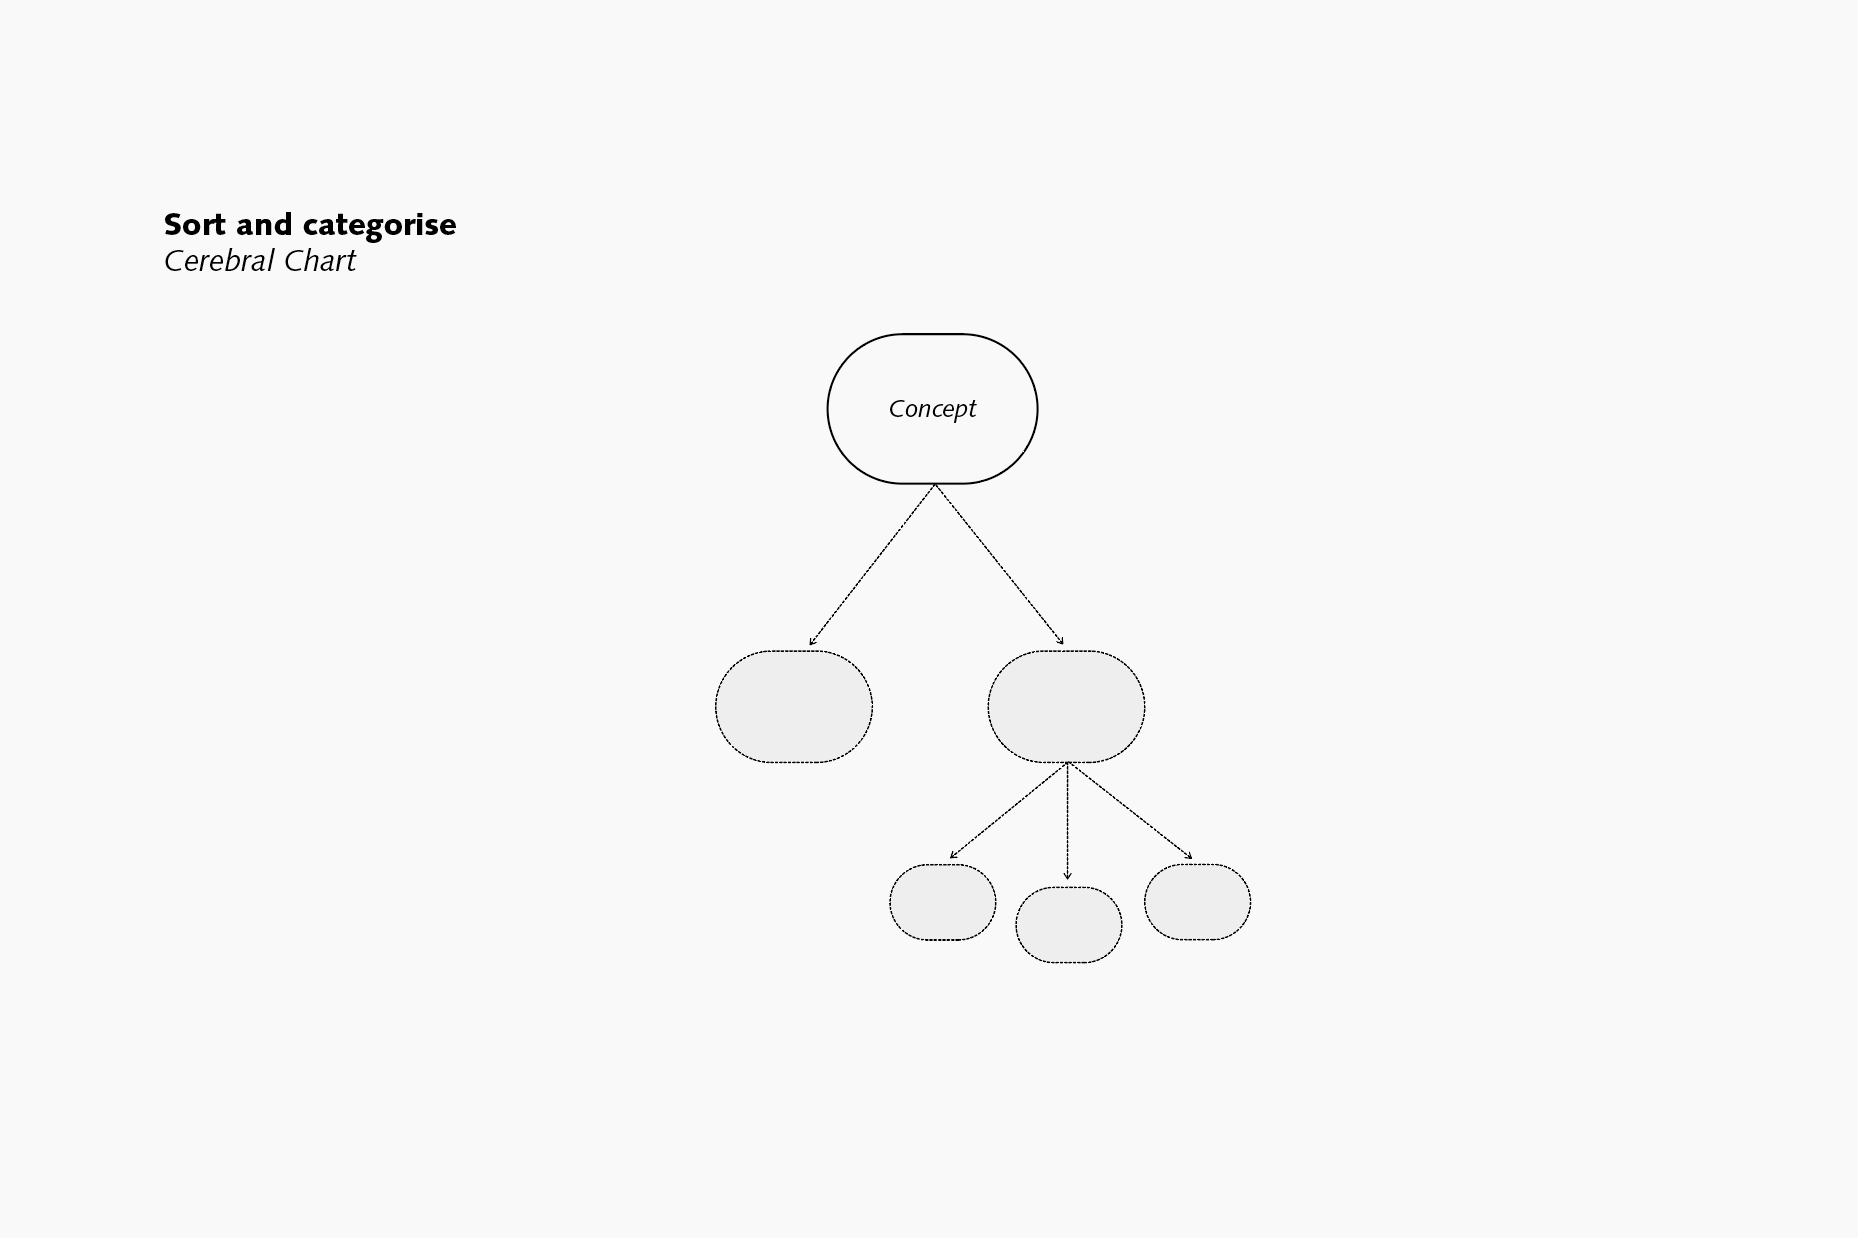
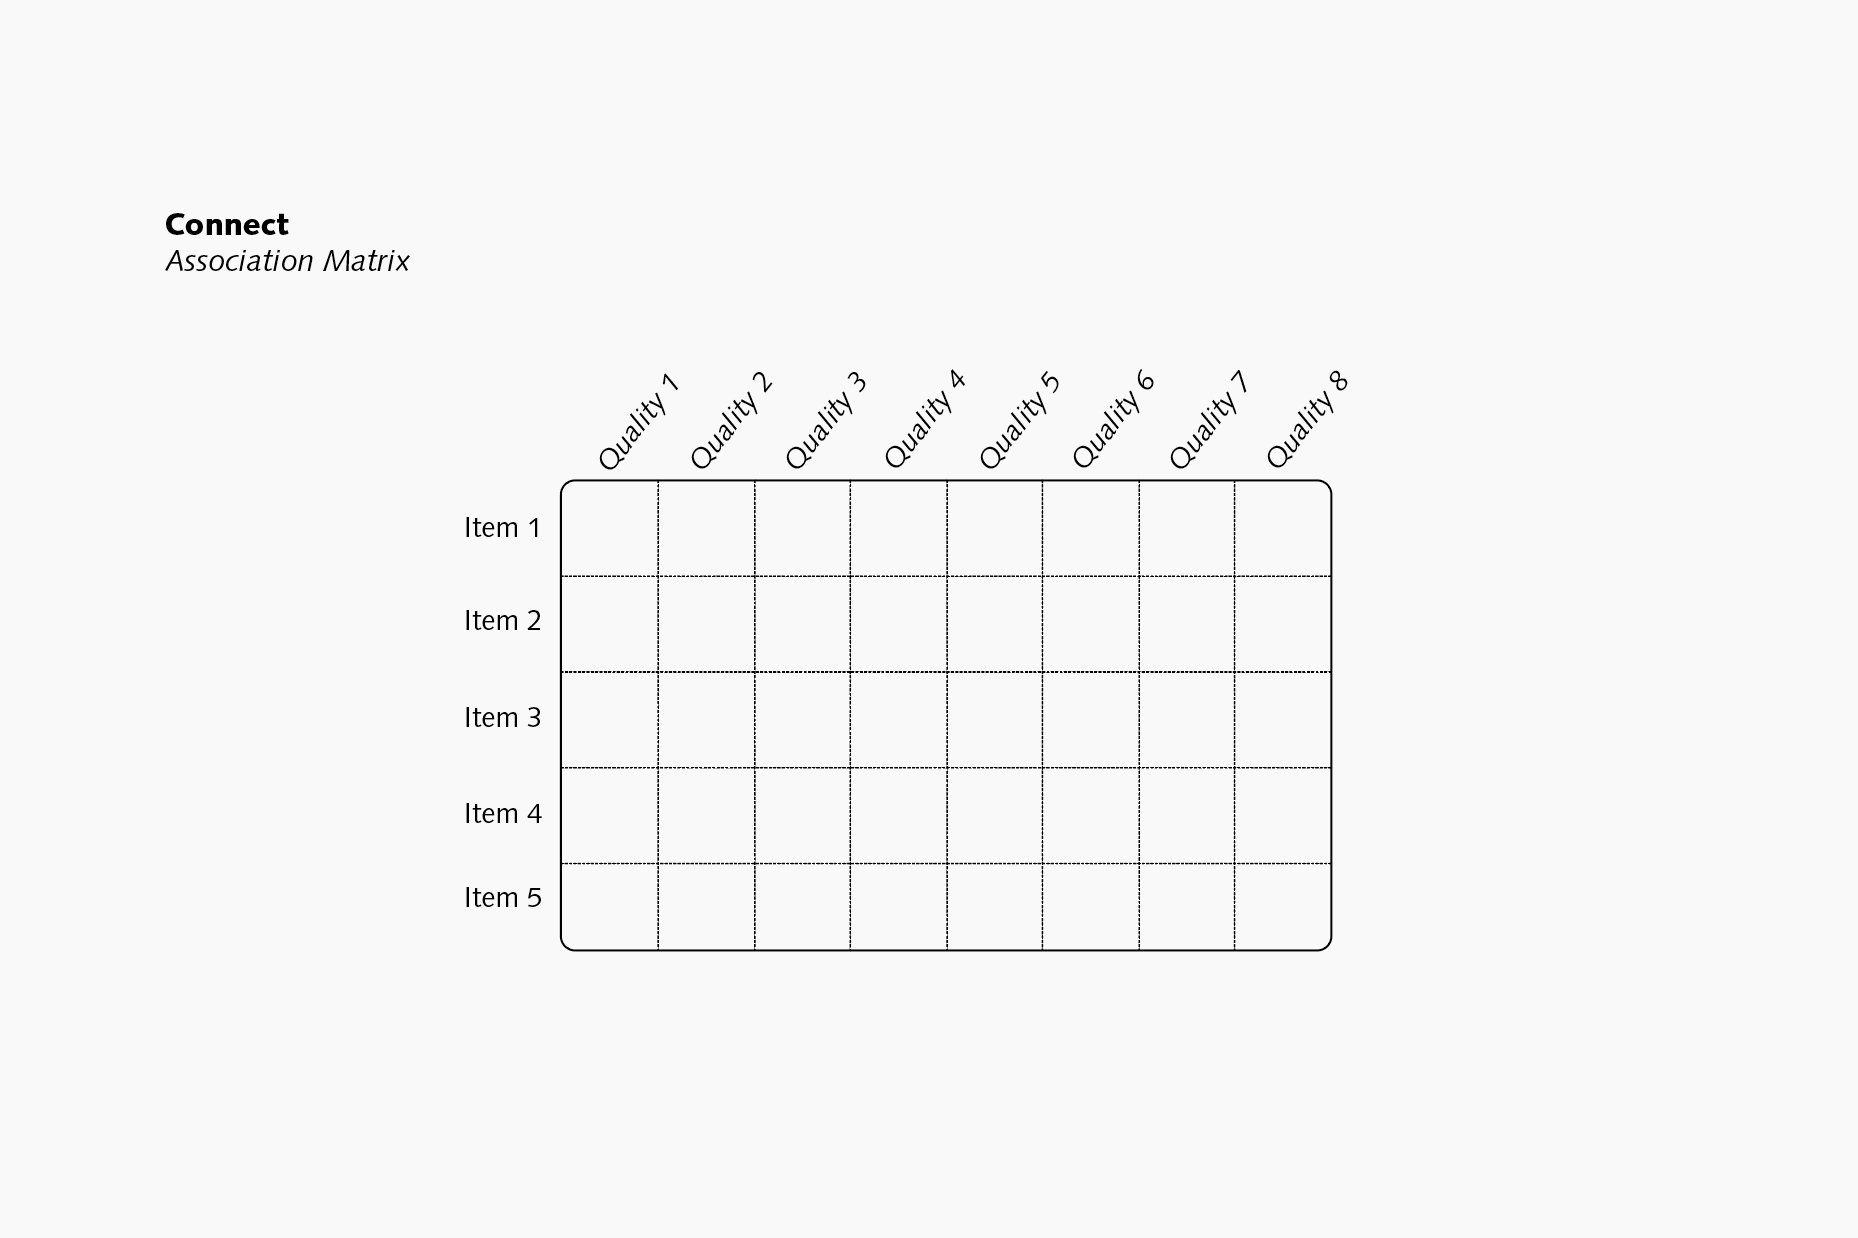
Graphics to illustrate the different types of graphs, charts and diagrams produced for the Visual Communication program at UTS.
The suite of visuals contained more than 20 graphics.
